
June 2026
Lubbock's economy remains strong, supported by higher retail sales, increased tourism, stronger commercial building activity, and rising commodity prices.
However, residential construction and vehicle sales are down, while inflation is rising again, partly due to higher energy prices.
YTD retail sales are up 11%, while May 2026 sales increased 7% compared with May 2025. New and used vehicle sales declined 8% over the same period.
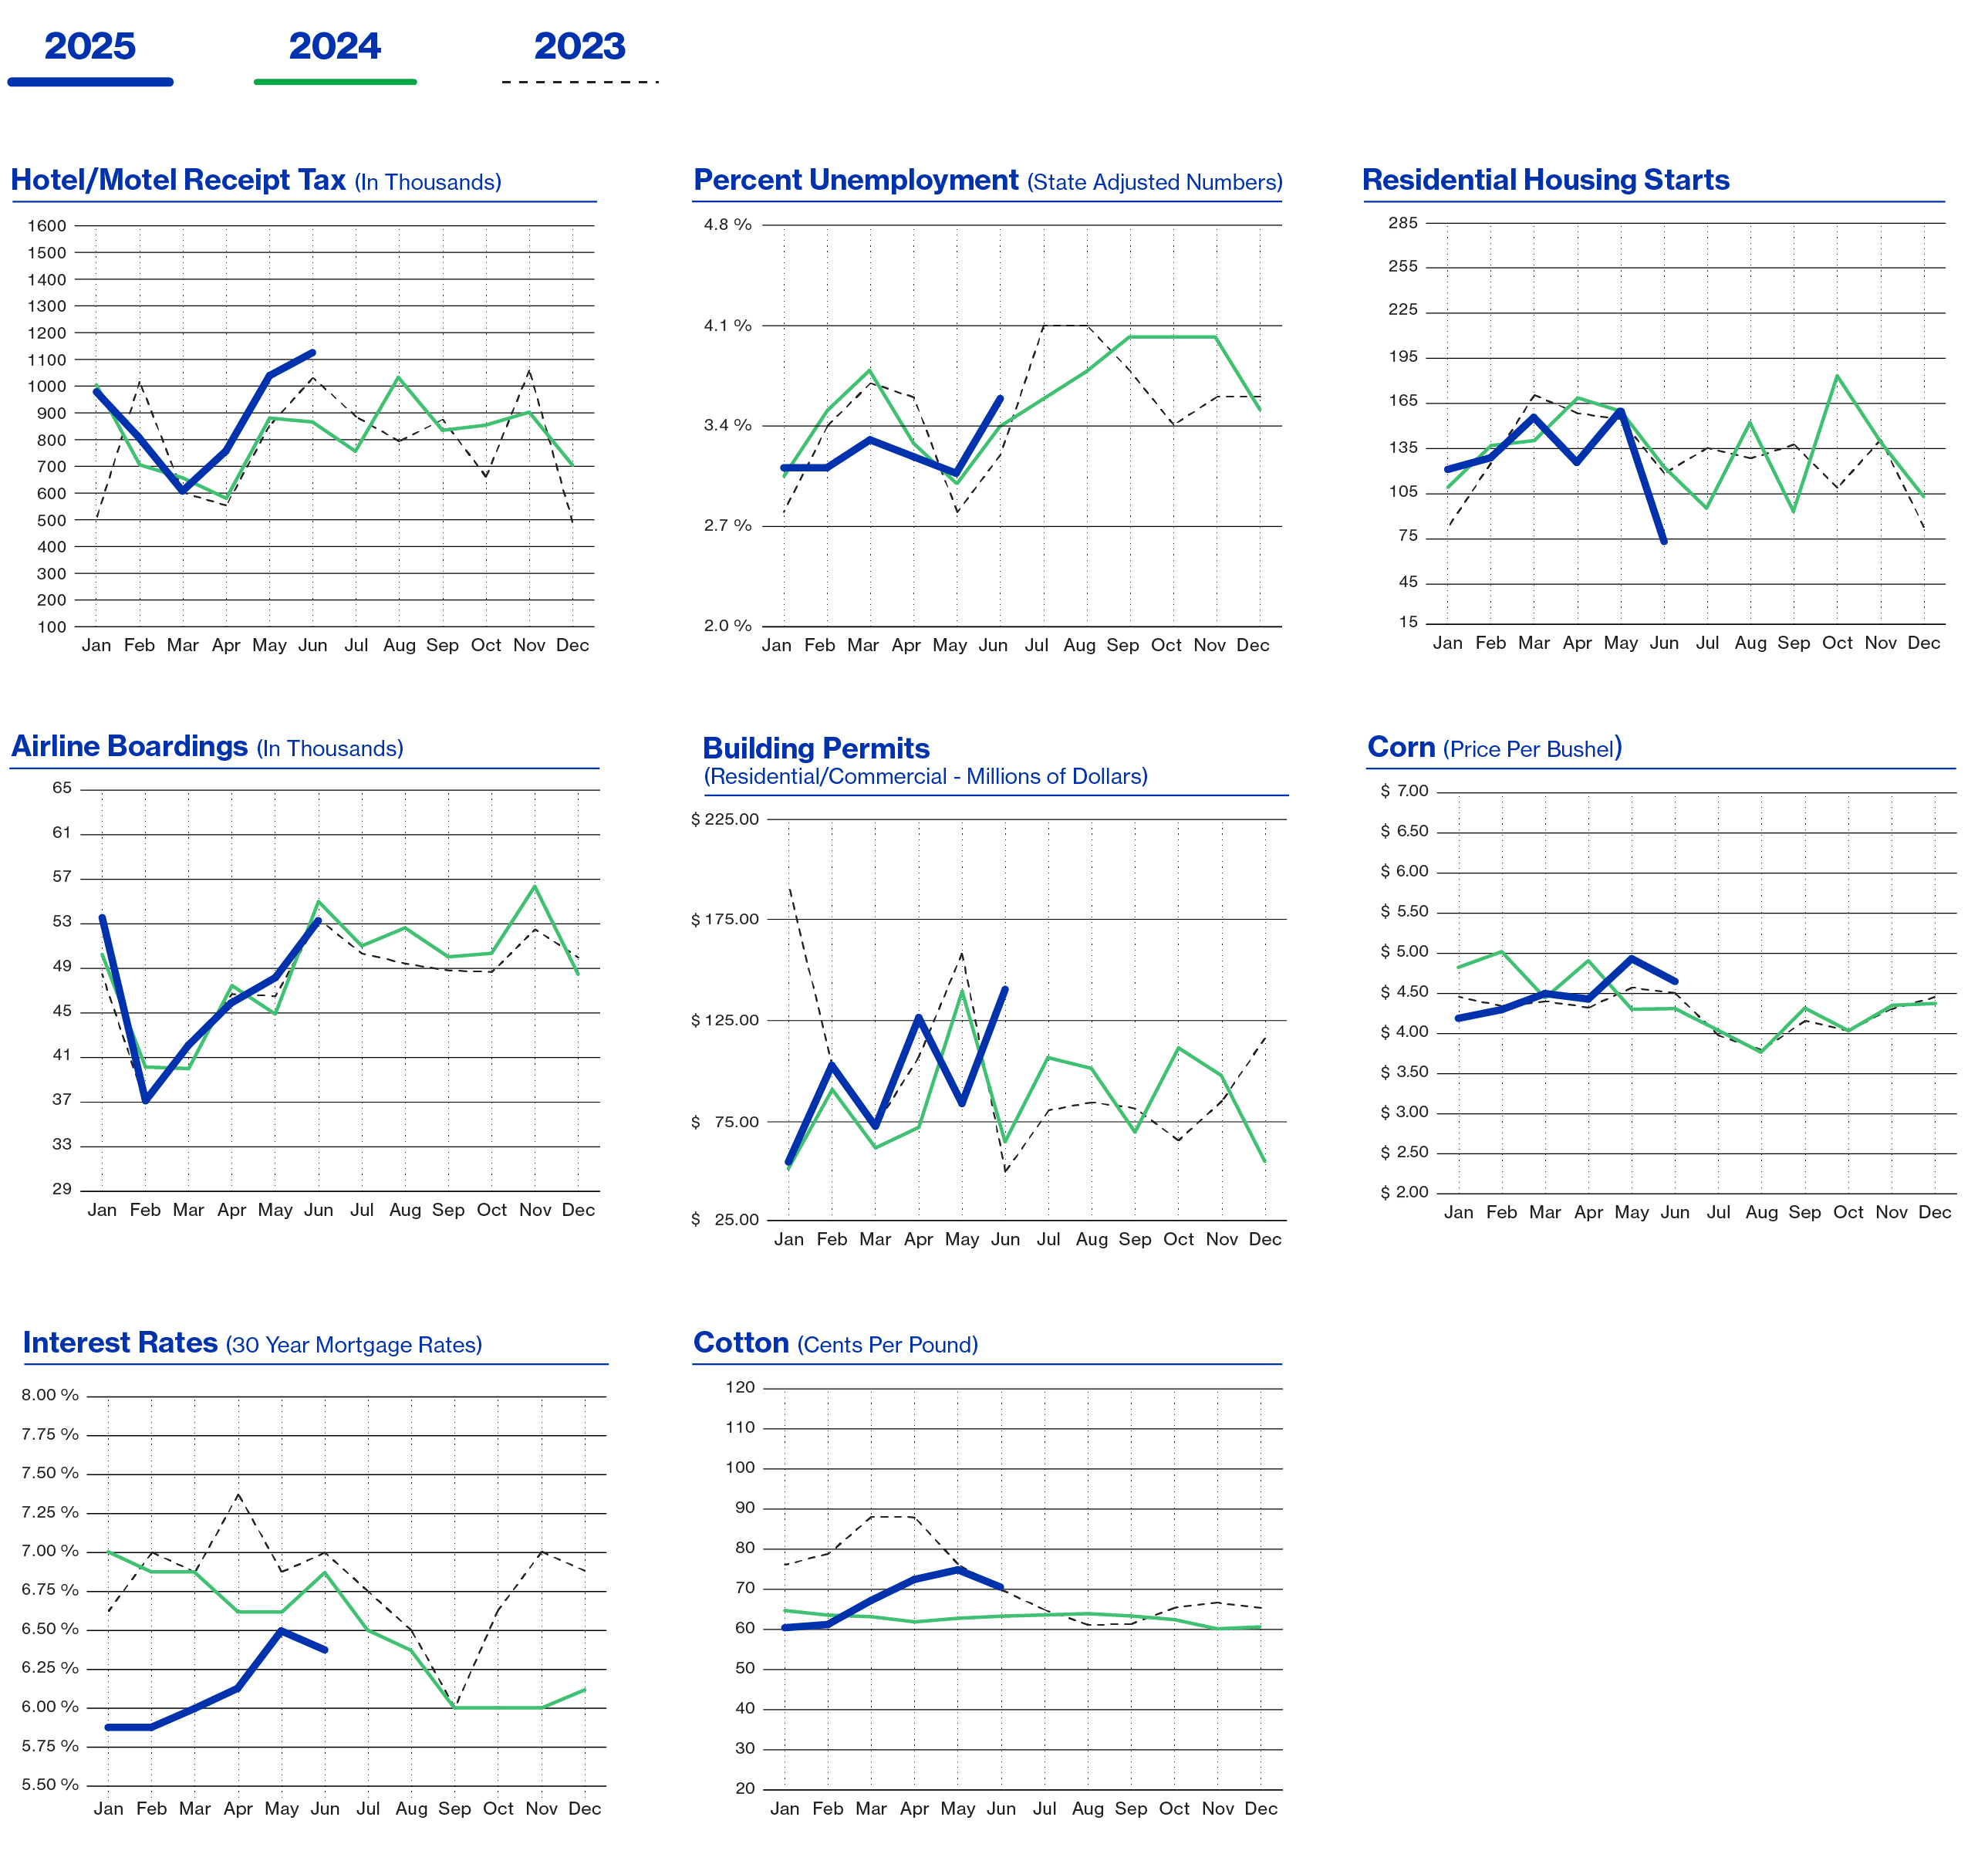
Hotel/motel tax collections continued to rise sharply in May 2026, up 29% from May 2025, driven in part by graduation activities at local universities and schools.
Employment in Lubbock showed a slight increase compared with last May. The labor force is up 1% from May 2025, while the unemployment rate has moved above 3% but remains below Texas's 4% rate. Wages are up 9% from the same period last year.
Mortgage rates are gradually decreasing and are 6% lower than this time last year. Current rate is 6.38%. However, rates continue to weigh on residential permitting activity, with residential permits down 39% from May 2025.
The total amount of residential activity declined by $78 million, or 24%, while single-family residential activity declined YTD by $18 million, or 8%. MTD activity in both total residential and single-family residential declined 33% and 29%, respectively, from last year.
Total building activity is up $69 million, or 109%, driven by commercial building activity. Commercial building activity is up 155% YTD, or $167 million. New commercial building activity this month includes the new Chick-fil-A project of $50 million, the Frenship North Elementary School project of $33 million, the new Ulta South Quaker location of $710 thousand, and the new AutoZone South Indiana location of $900 thousand.
YTD energy markets moved in different directions, with oil prices up 7% and natural gas prices down 22%.
Agricultural commodity prices also varied, with cotton prices increasing 11%, cattle prices up 14%, and milk prices down 14%. Cotton production remains mixed, with some strong stands and some weak or failed dryland acres. Additional rainfall remains imperative for dryland cotton.
See our attached white paper on Lubbock Employment Numbers.
Economic Pulse
| Economic Components | Current Month | Last Month | Last Year |
|---|---|---|---|
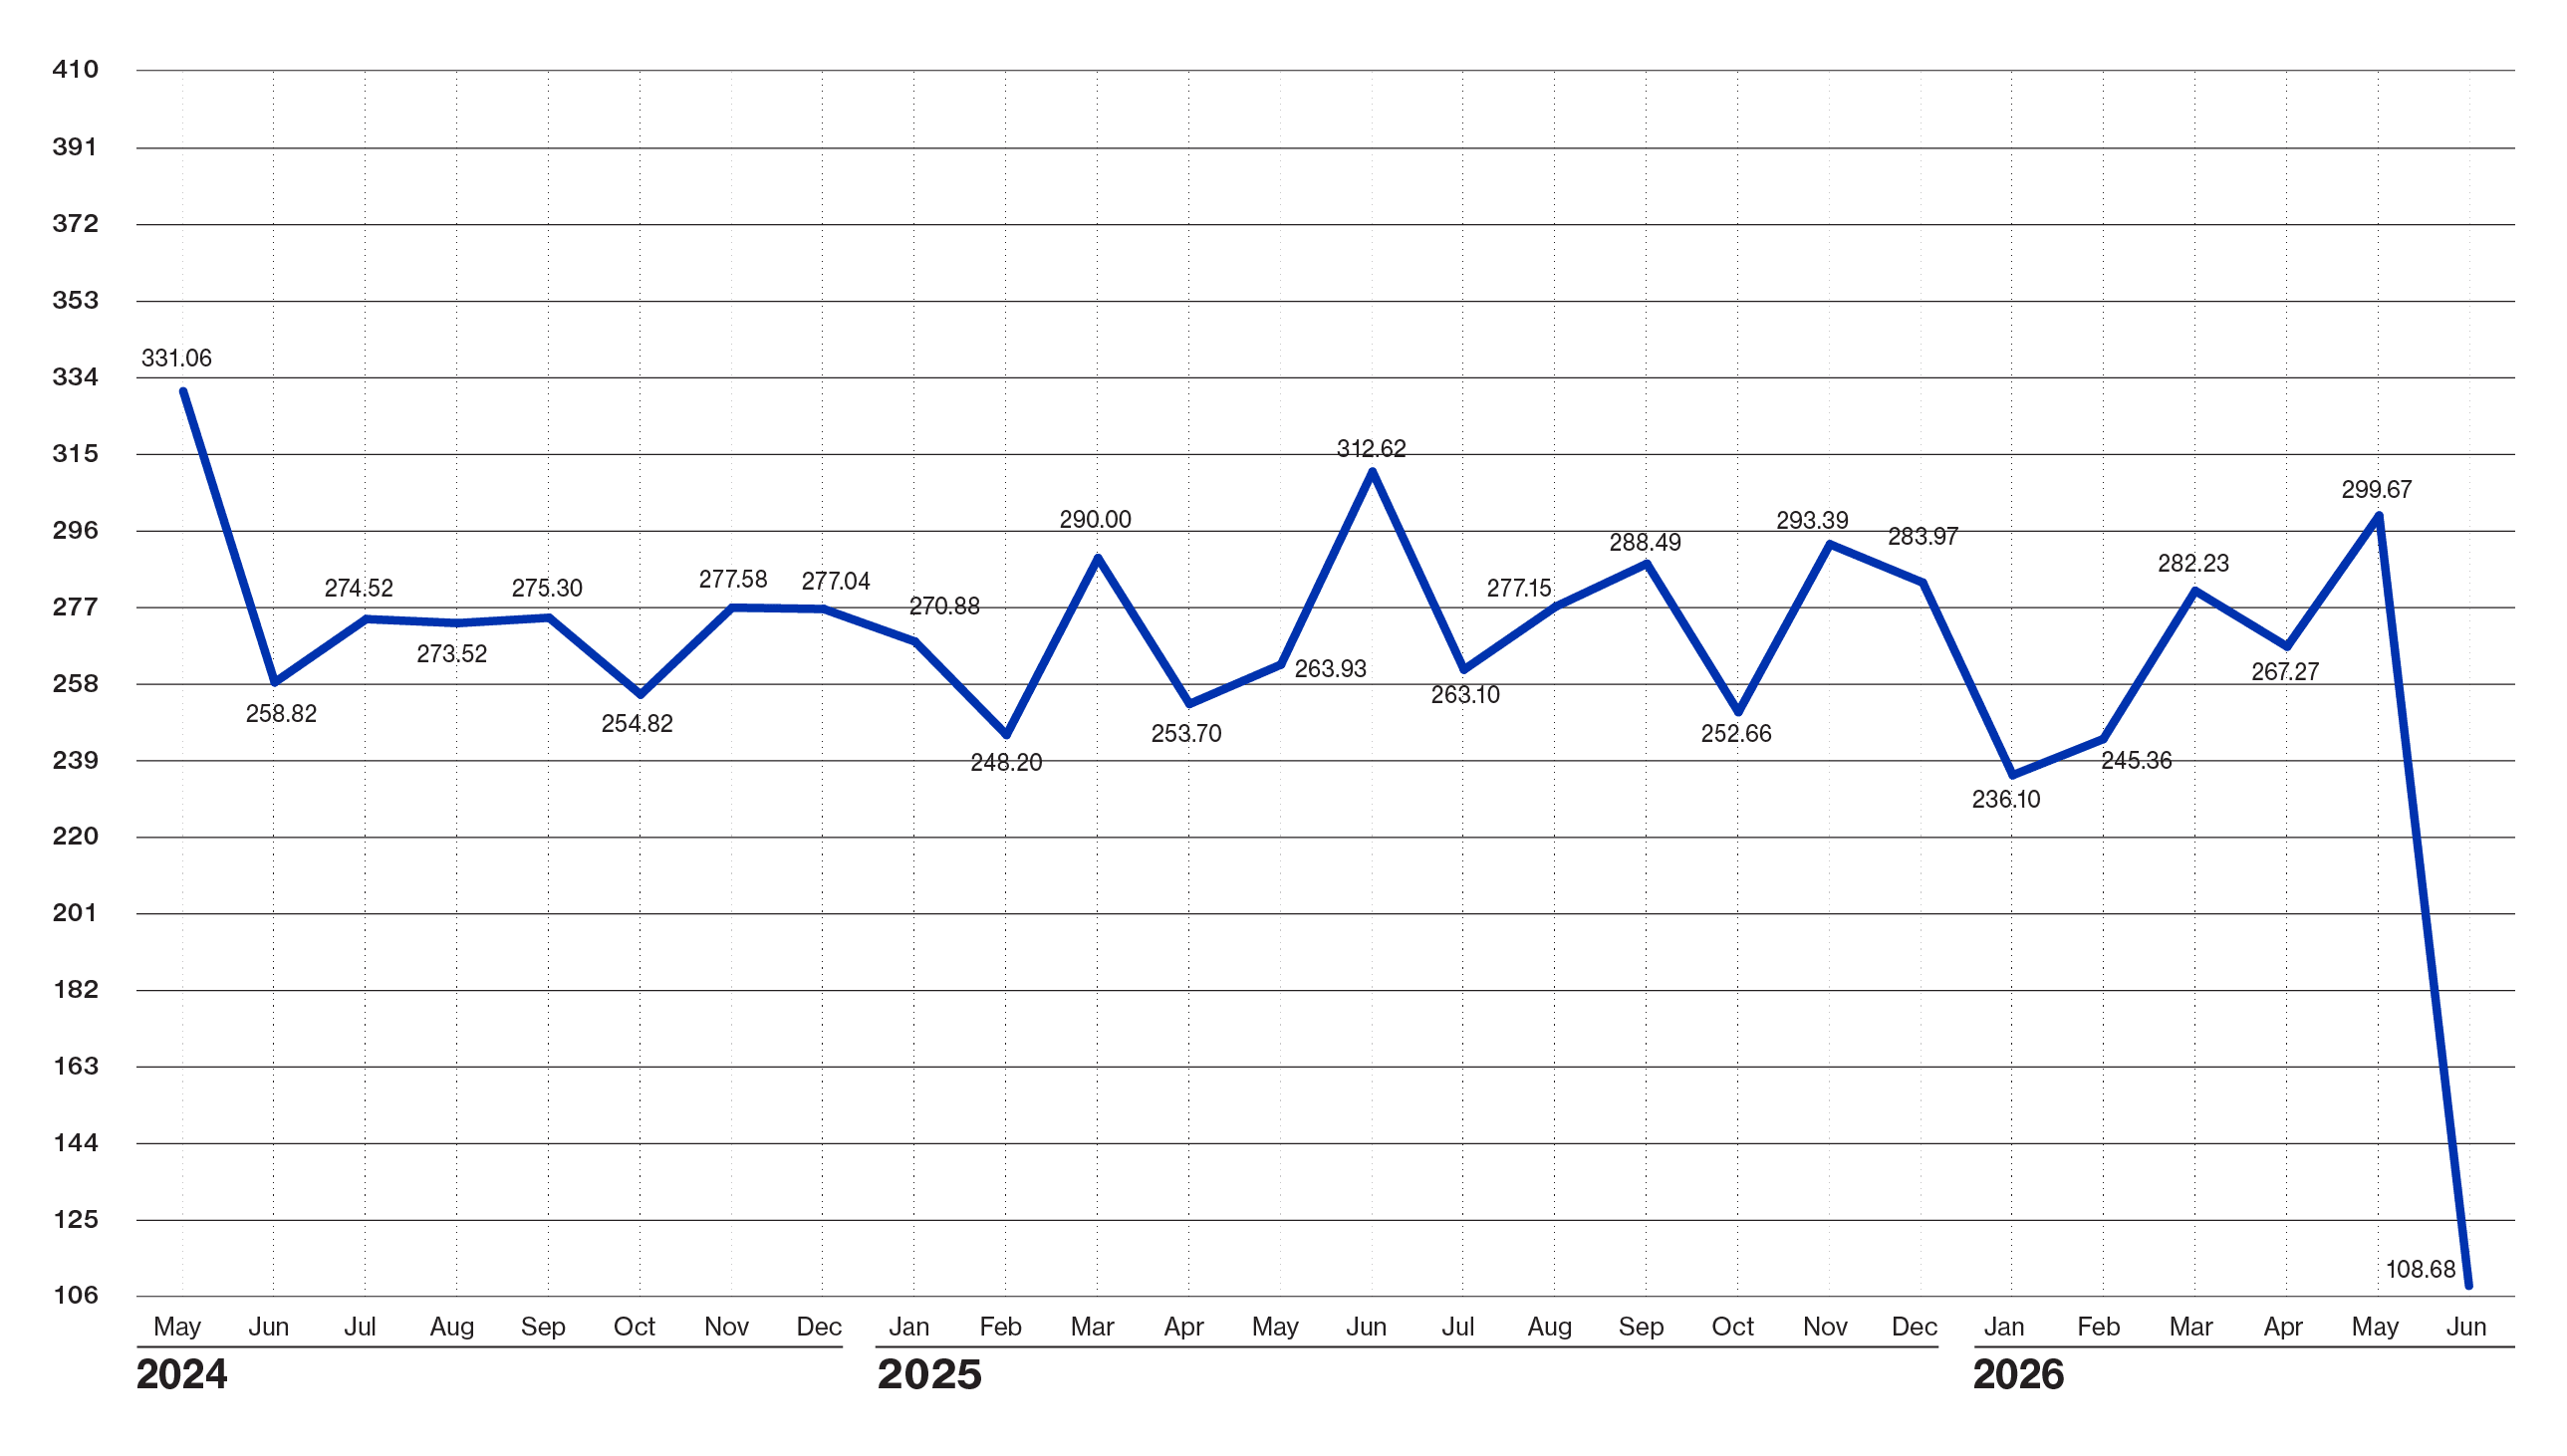
| Index (Base Jan. 88 @ 100) | $ 108.68 | $ 299.67 | $ 312.62 |
| Sales Tax Collections | $ 9,515,696 | $ 10,979,128 | $ 8,585,302 |
| Sales Tax Collection-YTD | $ 57,598,899 | $ 48,083,202 | $ 53,867,194 |
| New Vehicle Sales | 1,086 | 908 | 1,188 |
| Used Vehicle Sales | 2,044 | 2,060 | 2,224 |
| Airline Boardings | 53,532 | 48,277 | 55,167 |
| Hotel/Motel Receipt Tax | $ 1,121,233 | $ 1,033,318 | $ 868,786 |
| Population | 272,086 | 272,086 | 272,086 |
| Employment - CLF | 187,951 | 187,629 | 186,583 |
| Unemployment Rate | % 3.60 | % 3.20 | % 3.30 |
| Total Workers Employed (Household Survey) | 181,174 | 181,570 | 180,399 |
| Total Workers Employed (Employers Survey) | 177,100 | 176,700 | 176,200 |
| Average Weekly Wages | $ 1,143.00 | $ 1,143.00 | $ 1,044.00 |
| Gas | 79,720 | 79,510 | 79,381 |
| Interest Rates: 30 Year Mortgage Rates | % 6.375 | % 6.500 | % 6.750 |
| Building Permits Dollar Amount | $ 132,533,587 | $ 87,719,527 | $ 63,322,693 |
| Year to Date Permits | $ 523,831,756 | $ 391,298,169 | $ 434,714,872 |
| Residential Starts | 74 | 161 | 122 |
| Year To Date Starts | 646 | 572 | 731 |
| Median House Sold Price | $ 238,987 | $ 235,000 | $ 238,280 |
| Drilling Rigs In Panhandle | 13 | 9 | 14 |
| Oil Price Per Barrel | $ 80.54 | $ 102.62 | $ 75.30 |
| Natural Gas | $ 3.11 | $ 2.88 | $ 3.99 |
| Wheat Per Bushel | $ 5.83 | $ 6.74 | $ 5.47 |
| Fed Cattle Per CWT | $ 257.00 | $ 260.00 | $ 225.00 |
| Corn Per Bushel | $ 4.66 | $ 4.90 | $ 4.37 |
| Cotton (Cents Per Pound) | $ 70.43 | $ 74.98 | $ 63.32 |
| Milk | $ 15.98 | $ 17.43 | $ 18.68 |
Prepare for the majestic dance of disclaimers!
This document was prepared by Lubbock National Bank on behalf of itself for distribution in Lubbock, Texas and is provided for informational purposes only. The information, opinions, estimates and forecasts contained herein relate to specific dates and are subject to change without notice due to market and other fluctuations. The information, opinions, estimates and forecasts contained in this document have been gathered or obtained from public sources believed to be accurate, complete and/or correct. The information and observations contained herein are solely statements of opinion and not statements of fact or recommendations to purchase, sell or make any other investment decisions.
Economic Pulse Charts
{beginAccordion h3}
2026 Economic Analysis
{endAccordion}
{beginAccordion h3}
2025 Economic Analysis
{endAccordion}
{beginAccordion h3}
2024 Economic Analysis
{endAccordion}
{beginAccordion h3}
2023 Economic Analysis
{endAccordion}